HOW TEST MEASUREMENTS ARE MADE
Information exchange is available through the harness system attached to the forehead, ankles and wrists. The harnesses are made of special conductive silicone, which allows for very low current electrical communication through the computer’s USB port, and a multi-functional interface box.
During the testing and assessment phase, a client’s biofeedback metrics are measured in response to nearly 7,000 items in 39 separate categories. This process takes approximately 4 to 7 minutes. The computer calculates an average response value between 0 and 2000, which results in a list defining the individual’s reactions or stress potentials. The greatest energy disturbances will be recorded and displayed at the top of the list. Each substance has its own distinctive, complex waveform, which is graphically viewed and represented by a unique fractal image. Additionally, the test matrix contains a detailed description of each substance.
HOW THE L.I.F.E. BIOFEEDBACK SYSTEM WORKS
The measurement made by the L.I.F.E. System is based upon the relationship between “action & reaction” by applying a challenge to the patient (“action”) and measuring the reaction of the human body as it answers the challenge (“reaction”).
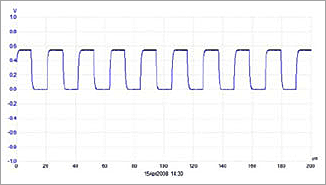
The basic principle of the mode of action of the L.I.F.E. System device is the following: The L.I.F.E. System device sends a square wave signal with amplitude of 5 volts, and a duty cycle of 50% to the harness. The frequency to be applied, for determination of our test, is about 47.3 kHz. The measurement current throughout the body is limited to a maximum of 10mA, but usually no more than 5mA or less.

Figure 1
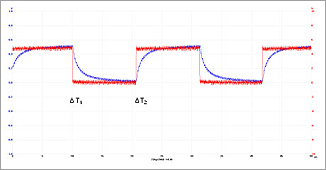
Figure 1 shows the applied signal without the harness being in contact with the human body. Once the harness is connected to the subject, a significant change, or deformation of the signal is detected. Figure 2 shows the respective signals (magnified to highlight the intricate differences in the waveform).

Figure 2
In this figure, we can see the superimposition of the waveforms. That is, the red representing the signal obtained without the harness attached to a human body, whereas the blue representing the signal when the subject is connected via the harness. As one can see, there is a significant difference in the shapes of the signal. The L.I.F.E. System utilizes the presence of such differences as a kind of baseline metric.
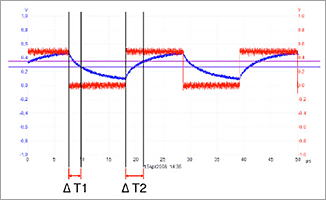
Using the steepness of the curve (the blue line while the subject is attached) the system measures the length of time spent in the upper or lower sections of the waveform (the distance from ΔT1 to ΔT2). When applying this approach to a subject where there is an imbalance (that is, when there is stress within the energy fields of the body), the signal returned to the system is less steep, resulting in a shorter distance from ΔT1 to ΔT2.

Figure 3
Figure 3 shows what the waveform may look like when there is an imbalance. Notice that the distances are shorter than in the earlier example where the waveforms were much steeper. Such waveform mathematics gives the L.I.F.E. System a clue, or put another way, the probability of an imbalance or stress potential for a given database item.
When a practitioner uses the L.I.F.E. System to identify potential imbalances, they then direct the system to provide the feedback of a pure waveform in an attempt to coax the body energies back to a state of equilibrium. It’s like telling the body, “This is what the energy signature is supposed to look like.” In the process of doing this, the L.I.F.E. System continues to monitor how well such feedback is being received by the subject's body.
This gives the practitioner a clue as to what areas need the most work. Sometimes subtle energy feedback alone is not enough and the client may need to seek other methods for diagnoses of a particular condition.

Figure 4
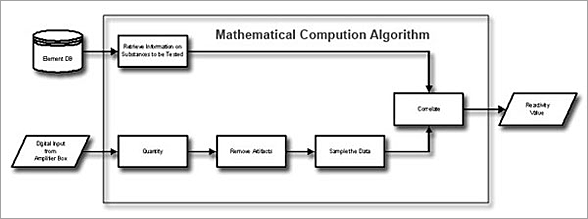
Figure 4 demonstrates the L.I.F.E. System workflow. The waveforms from database elements are compared with the subject’s measurement data, once this data has been normalized and cleaned (for example removing artifacts resulting from things like EMC fields). This comparison leads to a reactivity value for each database item tested. The culmination of all these measured items results in a considerable amount of data concerning potential areas of imbalances and stress within the subject’s body.
It is believed that imbalances in the body’s energy may lead to physical, biochemical aberrations. Even temperatures within various areas of the body are indications of abnormalities, which govern the shape and length of the waveform signals received by the L.I.F.E. System, as described in the previous sections.
Literature describing the effectiveness and mode of action of the L.I.F.E. System was the subject of a 2006 clinical investigation, the results of which yielded approval for European Class 2-A Certification.